Global sea level has been rising at a rate of 0.1 inches (3.3 millimeters) per year in the past three decades. The causes are mostly the thermal expansion of warming ocean water and the addition of fresh water from melting ice sheets and glaciers. But even as the sea takes up more space, the elevation of the land is also changing relative to the sea.


What geologists call vertical land motion—or subsidence and uplift—is a key reason why local rates of sea level rise can differ from the global rate. California offers a good example of how much sea level can vary on a local scale.
“There is no one-size-fits-all rule that applies for California,” said Em Blackwell, a graduate student at Arizona State University. Blackwell worked recently with Virginia Tech geophysicist Manoochehr Shirzaei to estimate vertical land motion along California’s coast by analyzing radar measurements made by satellites. The research team—which also included Virginia Tech’s Susanna Werth and Geoscience Australia’s Chandrakanta Ojha—found that up to 8 million Californians live in areas where the land is sinking, including large numbers of people around San Francisco, Los Angeles, and San Diego.
Land can rise or fall as a consequence of natural and human-caused processes. Key natural processes include tectonics, glacial isostatic adjustment, sediment loading, and soil compaction, explained Shirzaei. Humans can induce vertical land motion by extracting groundwater and through gas and oil production.
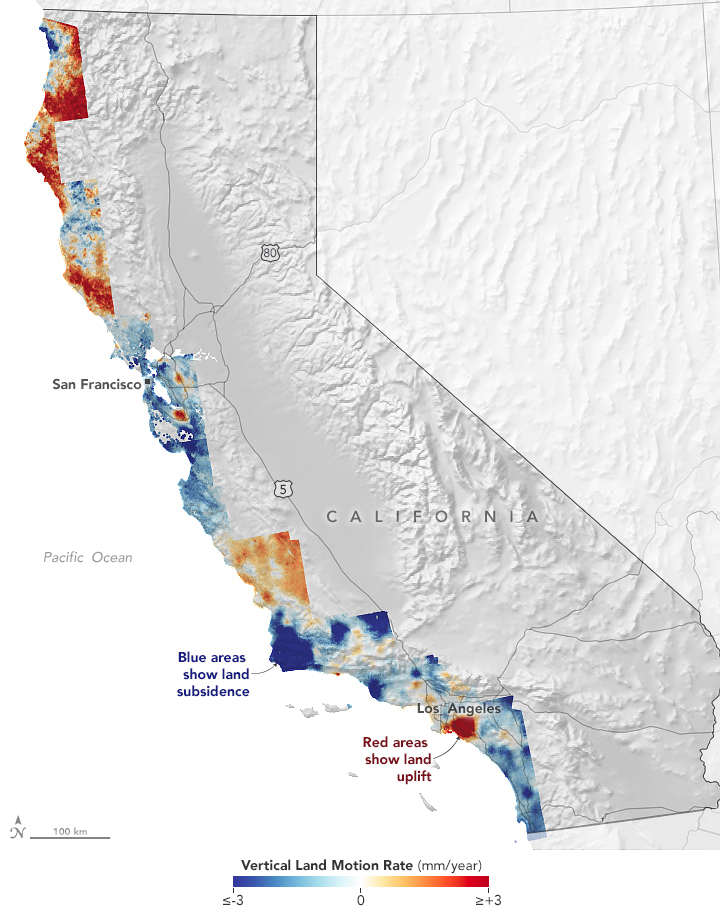
The map at the top of this page highlights the variability in the rising and falling of land across California’s 1000-mile (1,500-kilometer) coast. Areas shown in blue are subsiding, with darker blue areas sinking faster than lighter blue ones. The areas shown in dark red are rising the fastest. The map was created by comparing thousands of scenes of synthetic aperture radar (SAR) data collected between 2007 and 2011 with more collected between 2014 and 2018. Blackwell and colleagues looked for differences in the data—a processing technique known as interferometric synthetic aperture radar (InSAR).
The radar data came from sensors on Japan’s Advanced Land Observing Satellite (ALOS) and Europe’s Sentinel-1A satellite. The researchers also made use of horizontal and vertical velocity data from ground-based receiving stations in the Global Navigation Satellite System (GNSS). The InSAR data shown in these maps have an average spatial resolution of 80 meters per pixel, more than one thousand times higher than previous maps based only on GNSS data.
The reasons why land uplifts or subsides in any given area can be complex. Over long time scales and large scales, tectonic plates can shift the land. For instance, in Northern California the subduction of the small Gorda plate beneath the North American plate at the Mendocino Triple Junction causes the crust to thicken and rise a few millimeters per year. But to the south of Cape Mendocino, the tectonic environment is quite different. Instead of one plate diving beneath another and pushing it upward, the Pacific Plate and the North American Plate grind past each other in a north-south direction, which causes significantly less uplift in central and southern California.
Other geologic forces work closer to the surface and over shorter spans of time. In river deltas, bays, valleys, and other areas where sediments pile up, land tends to sink over time from the added weight—a process called sediment loading. It also sinks because particles of sediments get squeezed together and compressed over time, explained Shirzaei, the project lead and a member of NASA’s sea level change science team. In fact, sediment compaction is the main reason that the areas around San Francisco Bay, Monterey Bay, and San Diego Bay have relatively high rates of subsidence.
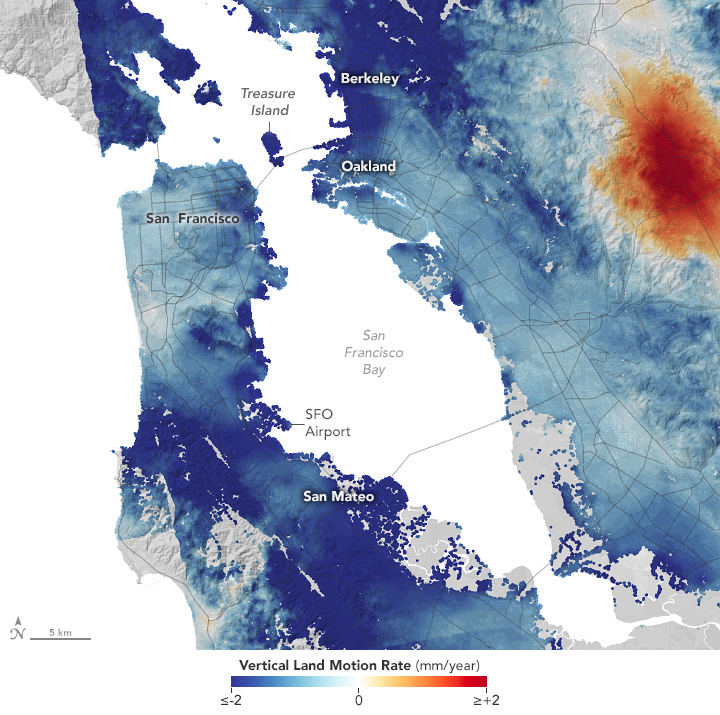
In the detailed map of San Francisco (above), note that the low-lying airport is subsiding. Subsidence is also particularly pronounced on Treasure Island in San Francisco Bay, which has seen subsidence exceeding 10 millimeters per year thanks in part to a landfill on the island. The area of uplift east of San Francisco in the Livermore Valley is likely caused by the underground aquifer refilling and rebounding after a long period of drought.
Human activities tend to have more short-term effects on vertical land motion. One example is the zone of strong uplift around Santa Ana, a valley just south of Los Angeles. That is mainly due to a groundwater management system that has replenished aquifers in recent years, a process that causes uplift. The map indicates one bit of positive news for Los Angeles: uplift along parts of the coast makes much of the city and its coastal suburbs less exposed to flooding hazards caused by increased sea level rise than other major coastal cities.
This picture of vertical land motion highlights the sea level rise planning and mitigation challenges that communities in many parts of the state face. “The dataset presented here can assist long-term resilience planning that enables coastal communities to choose among a continuum of adaptation strategies to cope with adverse impacts of climate change and sea-level rise,” said Shirzaei.
NASA Earth Observatory images by Lauren Dauphin, using data from Blackwell, Em, et al. (2020) and topographic data from the Shuttle Radar Topography Mission (SRTM). Story by Adam Voiland.
Get Citizensjournal.us Headlines free SUBSCRIPTION. Keep us publishing – DONATE


Enjoyed the maps. Large areas of SF including SFO were built on fill, so it is a disaster waiting to happen again. The Millennium Towers condo in the SF South of Market area has sunk 18 inches and they are trying to retrofit the building. During the 1989 Loma Preta earthquake, the marina area suffered the most due to construction on fill. If uplifts are a result of aquifers filling, this would appear to be a positive result of groundwater management. Much detail to study here.