
by Robert Mulligan
The Consumer Price Index (CPI) is the best known and most widely used measure of prices for the US. This index is prepared monthly by the Department of Labor for the 32 largest cities in the US. Although it ignores rural prices, it still covers 90% of the US population. The annual percentage change in the CPI is the most widely used measure of inflation. Until recently, inflation has been under control in the United States, but it is very high in some other countries. For example, in Zimbabwe in 2008, prices doubled every day. More recently, Argentina, Turkey, Russia, and Venezuela also experienced severe depreciation of their currency. High inflation can significantly impair an economy’s performance, to the extent that economic policymakers claim a low and stable rate of inflation as one of their chief objectives.
The origin of the CPI was a conference among Labor Department researchers in 1919. Although the Labor Department had collected data on food prices since 1888, high inflation during and after World War I convinced them of the need to include a broader range of consumer goods. The Labor Department wanted a measure of consumer prices to interpret the wage data they already collected. The initial choice of what food items to include in 1888 was decidedly unscientific, as the researchers simply went home and asked their wives what they bought every month. The 1919 basket of goods was chosen based on surveys that determined what kinds of consumer goods were purchased most regularly. Each month, Labor Department researchers priced the survey basket in the 32 cities included in the CPI. Every ten years, the CPI basket is adjusted based on a new survey to reflect changes in consumer behavior and preferences, the introduction of new goods, and the discontinuation of other goods.
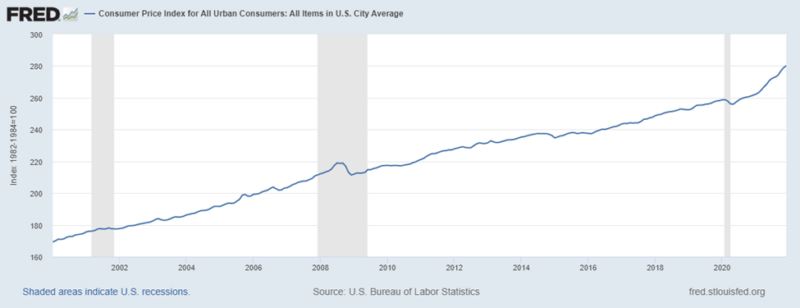
Figure 1 shows the fairly steady upward march of the CPI since 2000, with short periods of deflation during the 2007-2009 Great Recession and the 2020 Covid-19 recession. Note that since the last recession, the CPI has grown notably faster than average—this is how we are currently experiencing 7.5 percent inflation.
Figure 1. Consumer Price Index for All Urban Consumers 2000-2022


Another adjustment the Labor Department has to make is called hedonic adjustment. To some extent, technological progress is captured by adjusting the composition of the basket of goods, adding new products and removing obsolete ones. Hedonic adjustment estimates the impact of very rapid technological progress which may combine falling prices with improving quality. For example, in 1948, the largest TV you could buy was part of an RCA Berkshire Festival Series combination radio tuner, phonograph, and television in a mahogany breakfront made for RCA by Baker Furniture. These retailed for about $4,000 at a time when that would purchase a new Cadillac. The TV was a 29-inch diagonal rear-projection black-and-white set. This was especially notable because the largest conventional cathode-ray-tube sets that could be manufactured at that time had a tiny 4-inch diagonal.
Today you can buy a much larger HDTV, providing a dramatically higher-quality color picture, for far less. Similarly, the first PCs retailed for around $20,000 in 1985, and by today’s standards were about as useful as doorstops. Not only has the price fallen below $1,000, but computing power, speed, and storage space have increased exponentially. As with the TVs, we’re now paying much less for a much better product. Hedonic adjustment attempts to capture the full impact of these improvements, which are greater than what the price decrease alone would suggest. Though car prices have gone up over the years, newer cars are safer, and are generally better made, more durable, and provide better fuel economy, and hedonic adjustment attempts to capture these kinds of quality improvements as well.
The CPI is currently based on an index of 1982 = 100, so its current value of 280 indicates that consumer prices, on average, are about 2.8 times what they were in 1982. Since 1982, M2 has increased by a factor of more than 10, M1 by a factor of almost 50, and the monetary base by a factor of over 36,000! With the way the Federal Reserve has managed the money supply, what really calls for an explanation is why prices are not already dramatically higher.
The annual percentage change in the CPI is the principle and most commonly used measure of price inflation. The major alternative is the GDP price deflator, which includes non-consumer goods, but excludes imports, because they are not part of US GDP. The main difference between the CPI and the GDP deflator is that the CPI is an index of representative prices of consumer goods, whereas the GDP deflator attempts to estimate the cumulative effect of any price changes in any domestically-produced goods and services, including investment goods or capital equipment. Imported goods are not included in the GDP deflator because they are never part of US GDP. Some import prices are included in the CPI.
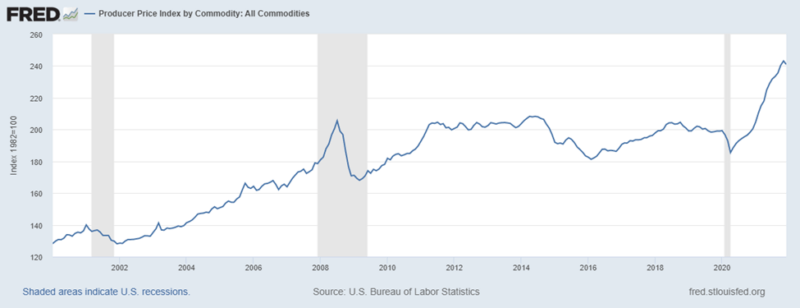
The Labor Department also collects data on producer prices, because with a time lag, these eventually factor into future CPIs. The Labor Department publishes a broad Producer Price Index (PPI) for all commodities, as well as specialized PPIs for different industries and commodity groups. Looking at the broad PPI for all commodities in Figure 2, we can see more pronounced deflation in commodity prices during each recession, because as businesses scaled back, their demand for commodities declined. There is also a notable deflation in 2014-2016, which may be attributable to increased oil production.
Figure 2. Producer Price Index, All Commodities 2000-2021


Because the producer prices captured in the PPI are later reflected in consumer prices captured in the CPI, the PPI can be taken as an early warning signal of what may be in store for the CPI with a probable lag of about six months to one year. If we calculate PPI inflation over the preceding 12-month period, we get a PPI inflation rate of 24 percent for all commodities. When we look at some of the more focused PPIs the picture is even more dire. For example, PPI inflation for metals-producing industries is an incredible and frankly quite alarming 45 percent over the last year. Before long, some of this will translate into higher consumer prices.
However, one shortcoming of both the CPI and PPI is the fixed basket of goods methodology built into these price indices. Using a fixed basket of goods ignores substitution. When the prices of some goods go up, our normal response is to substitute cheaper goods to stretch our budget. Firms and consumers both do this. However, many manufacturing firms or construction activities will be limited in the extent they can substitute alternative materials for steel or aluminum, especially in the short run. No matter how much substitution businesses attempt, they have to use some commodities to produce their output. With PPI inflation for all commodities at 24 percent, though that does not necessarily forecast a future CPI increase that high, it strongly suggests CPI inflation will continue to rise.
TELL YOUR FRIENDS ABOUT CITIZENS JOURNAL Please keep us publishing – DONATE


